This function plots a simple normal distribution or a normal distribution with shaded areas that indicate at which value a significant p-level is reached.
Usage
dist_norm(
  norm = NULL,
  mean = 0,
  sd = 1,
  p = NULL,
  xmax = NULL,
  geom.colors = NULL,
  geom.alpha = 0.7
)
Arguments
- norm
Numeric, optional. If specified, a normal distribution with
meanandsdis plotted and a shaded area atnormvalue position is plotted that indicates whether or not the specified value is significant or not. If bothnormandpare not specified, a distribution without shaded area is plotted.- mean
Numeric. Mean value for normal distribution. By default 0.
- sd
Numeric. Standard deviation for normal distribution. By default 1.
- p
Numeric, optional. If specified, a normal distribution with
meanandsdis plotted and a shaded area at the position where the specified p-level starts is plotted. If bothnormandpare not specified, a distribution without shaded area is plotted.- xmax
Numeric, optional. Specifies the maximum x-axis-value. If not specified, the x-axis ranges to a value where a p-level of 0.00001 is reached.
- geom.colors
user defined color for geoms. See 'Details' in
plot_grpfrq.- geom.alpha
Specifies the alpha-level of the shaded area. Default is 0.7, range between 0 to 1.
Examples
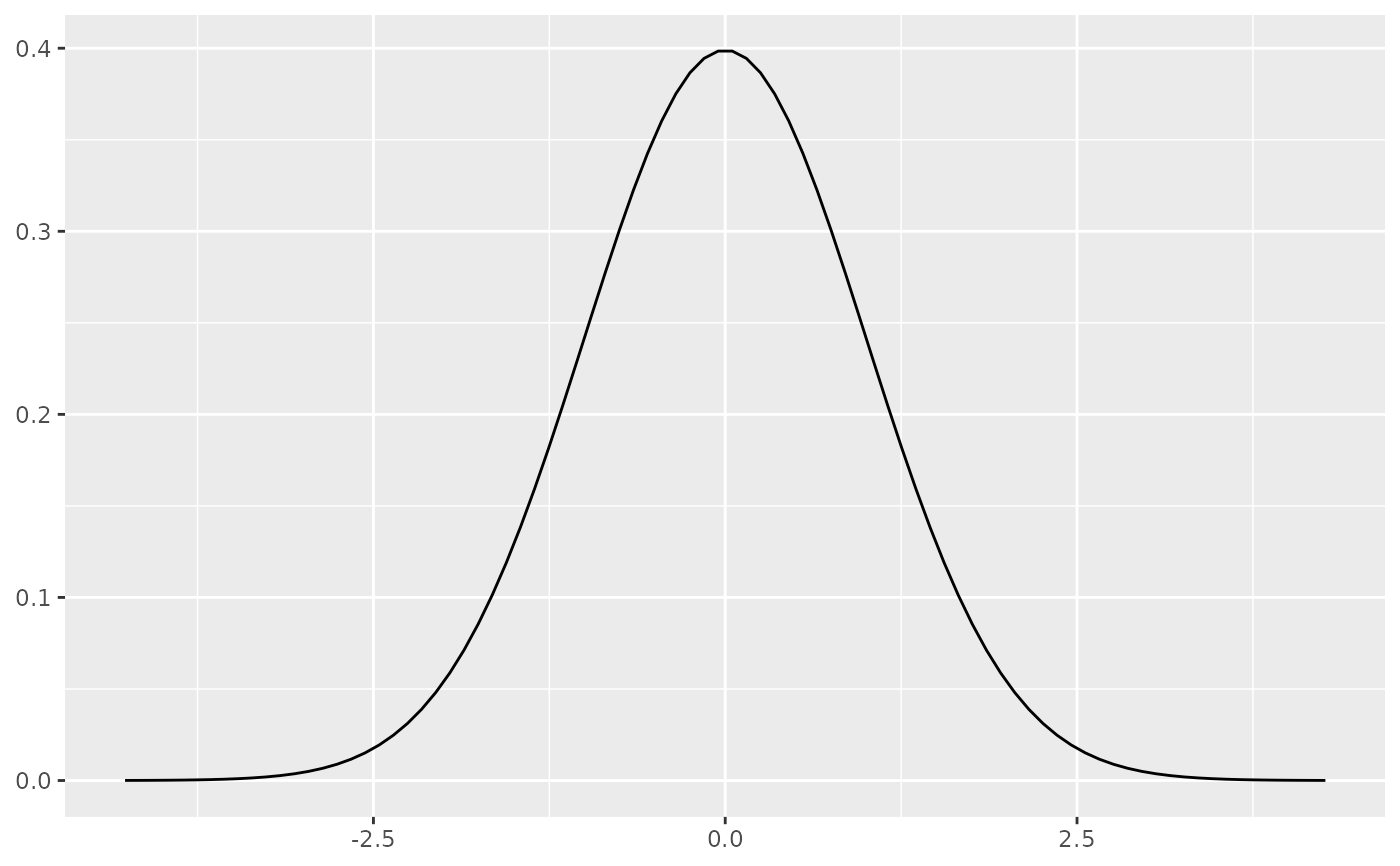
# a simple normal distribution
dist_norm()
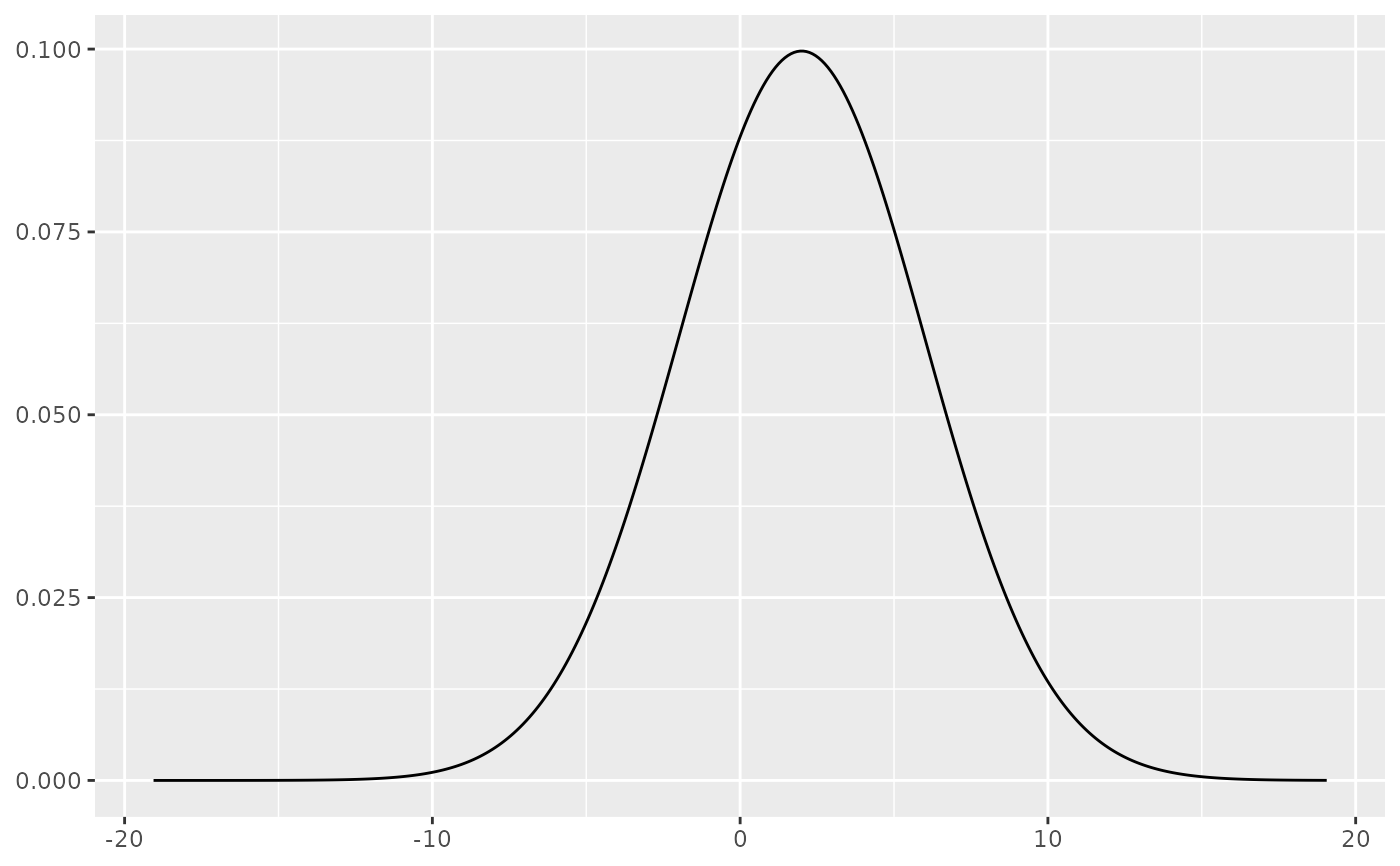
 # a simple normal distribution with different mean and sd.
# note that curve looks similar to above plot, but axis range
# has changed.
dist_norm(mean = 2, sd = 4)
# a simple normal distribution with different mean and sd.
# note that curve looks similar to above plot, but axis range
# has changed.
dist_norm(mean = 2, sd = 4)
 # a simple normal distribution
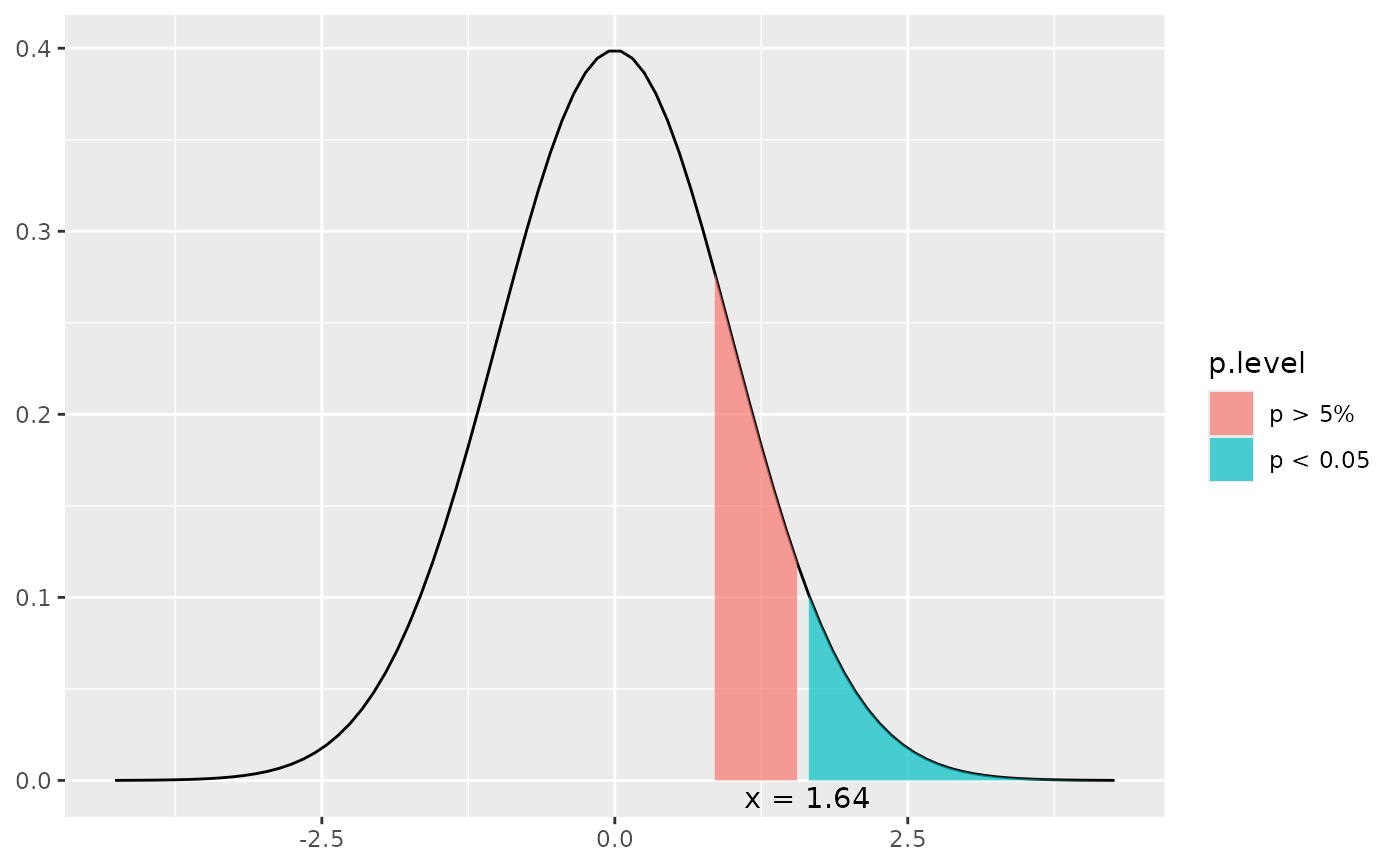
dist_norm(norm = 1)
# a simple normal distribution
dist_norm(norm = 1)
 # a simple normal distribution
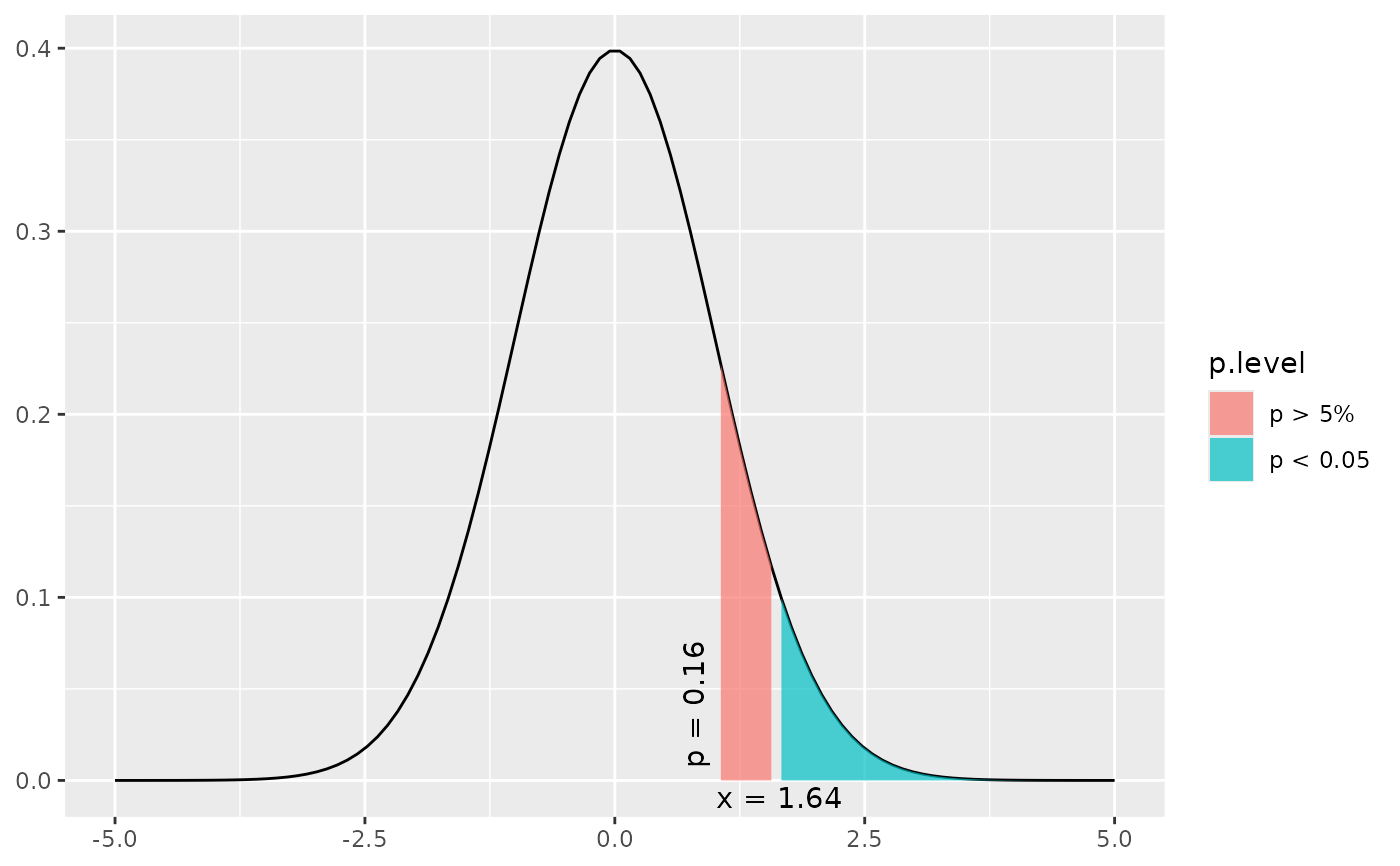
dist_norm(p = 0.2)
# a simple normal distribution
dist_norm(p = 0.2)